Searches that surface Korean aesthetic products come overwhelmingly from one country, and then from a long, uneven list of others. In ninety days of our search data, the United States produced a little over a third of all impressions and four in ten clicks. What makes the data worth reading is not the leader but the runner-up, because it changes by category. For lipolytic injections the Philippines overtakes the United States. For dermal fillers the second market is Thailand. For hair and exosome products it is Bangladesh. The same catalogue draws from a different map depending on what someone is looking for.
The sample
The figures come from Google Search Console for kstations.com over the ninety days from 14 June to 11 September 2026, grouped by the country Google attributes to each search. Across all pages the site was shown 434,183 times and clicked 15,793 times. Restricting to product pages alone gives 140,828 impressions and 4,327 clicks, and that product-page subset is what allows the categories to be separated.
The overall map: one dominant market and a long tail
| Country | Impressions | Share | Clicks | Share of clicks | Click rate |
|---|---|---|---|---|---|
| United States | 157,029 | 36.2% | 6,410 | 40.6% | 4.1% |
| Philippines | 38,515 | 8.9% | 1,287 | 8.1% | 3.3% |
| United Kingdom | 17,138 | 3.9% | 531 | 3.4% | 3.1% |
| South Korea | 14,460 | 3.3% | 589 | 3.7% | 4.1% |
| Malaysia | 11,947 | 2.8% | 451 | 2.9% | 3.8% |
| Canada | 10,910 | 2.5% | 660 | 4.2% | 6.0% |
| Netherlands | 10,864 | 2.5% | 573 | 3.6% | 5.3% |
| India | 9,999 | 2.3% | 172 | 1.1% | 1.7% |
| Indonesia | 8,841 | 2.0% | 183 | 1.2% | 2.1% |
| Australia | 8,645 | 2.0% | 477 | 3.0% | 5.5% |
| Germany | 8,161 | 1.9% | 394 | 2.5% | 4.8% |
| Pakistan | 7,604 | 1.8% | 120 | 0.8% | 1.6% |
The United States is not merely first. It is larger than the next eleven countries in the table combined, and its share of clicks is higher than its share of impressions. The Philippines is a clear second at under a tenth of impressions. After that no single country exceeds four percent, and the list runs on through dozens of markets each contributing one or two percent.
Read as a structure, this is a long-tail demand map with a single heavy head. A product line that performs well in search for Korean aesthetic products is, in practice, performing well in the United States first, and then across a scattered group of markets in Southeast Asia, Europe, the Gulf and South Asia.
Impressions and clicks draw two different maps
A group of higher-income markets click more often than their impressions alone would predict. Canada is clicked at 6.0 percent, Australia at 5.5 percent, the Netherlands at 5.3 percent and Germany at 4.8 percent, all above the United States at 4.1 percent. Their share of clicks is noticeably larger than their share of impressions.
Another group appears in search far more than it clicks. India is clicked at 1.7 percent, Pakistan at 1.6 percent, Indonesia at 2.1 percent, and the United Arab Emirates and Thailand at under two percent. Those markets together are a substantial share of impressions and a much smaller share of clicks.
Category by category, the second market changes
| Category | Impressions | First | Second | Third |
|---|---|---|---|---|
| Vitamin and injectable | 33,466 | United States 13,419 | Philippines 5,669 | Pakistan 1,135 |
| Skin booster and ampoule | 32,829 | United States 10,526 | Philippines 1,596 | Malaysia 1,535 |
| Contour and lipolysis | 24,209 | Philippines 7,062 | United States 6,841 | Malaysia 1,579 |
| Botulinum toxin | 23,866 | United States 6,770 | Philippines 1,615 | United Kingdom 1,391 |
| Dermal filler | 19,613 | United States 6,320 | Thailand 1,038 | Pakistan 691 |
| Exosome and hair | 3,757 | Bangladesh 921 | United States 822 | United Kingdom 222 |
| Numbing cream | 2,963 | United States 1,552 | Philippines 100 | Japan 75 |
Two categories have a leader other than the United States, and two more have an unexpected runner-up. Each is worth a closer look, because each suggests that the category's buyers are not the same people as the catalogue's buyers in general.
Lipolytics: the one large category the Philippines leads
Contour and lipolysis products are the only large category in which the United States is not first by impressions. The Philippines produced 7,062 impressions against 6,841 from the United States, with Malaysia a distant third at 1,579.
The click picture is different. The United States produced 334 clicks in the category and the Philippines 150. Visibility is higher in the Philippines; visits are higher in the United States. Germany, with 678 impressions, produced 47 clicks, a click rate close to seven percent and one of the highest for any country in any category.
Fillers: Thailand in second place
Dermal fillers follow the general pattern at the top, with the United States producing 6,320 impressions. The second country is Thailand, with 1,038, ahead of Pakistan, South Korea and the Philippines.
Thai filler searches convert poorly by click rate: 1,038 impressions produced five clicks. South Korea, with 688 impressions, produced 19. That contrast is a reminder that visibility in a market is not the same as relevance to it. Searches can surface a page for a brand name without that page being what the searcher, in their language and market, was looking for.
Hair and exosome products: a market led by Bangladesh
The exosome and hair category is small in absolute terms, 3,757 product-page impressions, and it is the only category led by a country outside both North America and Southeast Asia. Bangladesh produced 921 impressions and 104 clicks, a click rate above eleven percent, against 822 impressions and 38 clicks from the United States.
The category is concentrated in a small number of products, and the most searched of them accounts for most of the Bangladeshi demand, often with a price word attached. That combination of a narrow product focus, a single leading market and a high click rate is unusual in the dataset. It describes a specific, well-defined pocket of interest rather than a broad category audience.
Toxins and vitamins: familiar leaders, different tails
Botulinum toxin pages follow the United States and the Philippines with the United Kingdom, Indonesia, Malaysia, Poland and Germany. It is the most European of the categories below the leader, with three European countries in its top seven. Vitamin and injectable pages, the largest category, have the heaviest concentration in the United States, 13,419 of 33,466 impressions, and a strong Philippine second, followed by Pakistan and Malaysia.
Skin boosters, the second largest category, have the most even tail. The Philippines, Malaysia, South Korea, Canada and Indonesia each contribute between about one thousand and sixteen hundred impressions, with no single second market standing out. That evenness fits a category with many brands and many product types, none of which dominates the category's search volume.
Product pages lean further toward Southeast Asia
Comparing all pages with product pages alone shows a shift that is easy to miss. The United States holds 36.2 percent of impressions across the whole site but 32.9 percent on product pages. The Philippines moves the other way, from 8.9 percent overall to 11.9 percent on product pages, and Malaysia from 2.8 to 3.9 percent.
The difference comes from what the other pages are. Articles, category guides and collection pages attract a larger share of informational searches, and those skew toward the United States, the United Kingdom and other English-first markets. Product pages attract searches for named products, and those are relatively stronger in Southeast Asia. In other words, searchers in the Philippines and Malaysia are more likely than searchers elsewhere to arrive looking for a specific product rather than for an explanation.
The click data on product pages sharpens the point. The United States takes 39.4 percent of product-page clicks from 32.9 percent of impressions, while the Philippines takes 8.9 percent of clicks from 11.9 percent of impressions. Bangladesh, small in impressions, has the highest product-page click rate of any country with more than a thousand impressions, at 7.2 percent.
One product can draw a whole country's map
Several of the category patterns turn out, on closer reading, to be patterns of a single product. That matters because it changes what the country data describes.
The hair and exosome category is led by Bangladesh, and one product accounts for almost all of that. Its product page drew 2,300 impressions in the period, and 908 of them came from Bangladesh, with 103 clicks. The United States contributed 259. Remove that one page and the category's country map looks like every other category's.
Lipolytics show the same effect at a larger scale. The most searched lipolytic product page drew 4,288 impressions from the Philippines and 2,160 from the United States. Its sibling product in a different presentation shows the same order, 2,254 from the Philippines and 1,705 from the United States. Between them they carry the category's Philippine lead.
Injectables show the opposite concentration. The most searched glutathione injection page drew 10,155 impressions, and 7,035 of them came from the United States, with the Philippines a distant second at 1,069. A single page with that profile is enough to anchor the United States lead in its whole category.
The lesson is a caution about reading any category map as a statement about the category's buyers in general. In a catalogue where a few products carry much of the search volume, a country's apparent preference for a category is often a preference for one product in it. The map is still accurate. It is simply narrower than it looks.
South Korea in its own search data
South Korea appears consistently in the top ten, with 3.3 percent of all impressions and a click rate of 4.1 percent, level with the United States. In the product categories it ranks fourth for skin boosters and fourth for fillers.
That is a modest but steady presence for searches made from inside the country the products come from. Searches in English from Korea come from many kinds of searcher, and the data does not distinguish between them. It does confirm that English-language demand for Korean aesthetic products is not purely an overseas phenomenon.
High click rates in smaller markets
Several of the highest click rates in the dataset come from markets that are small in impressions. Canada, the Netherlands, Australia and Germany sit between about eight and eleven thousand impressions across all pages, each under three percent of the total, and each clicks at between 4.8 and 6.0 percent. Bangladesh, under one percent of impressions, clicks at 6.6 percent across all pages and above seven percent on product pages.
A high click rate in a small market usually means that when our pages appear there, they appear for exactly the thing the searcher wanted. In several of these countries the searches are narrow: a specific product, sometimes with a strength or price attached. The result is a small volume of very targeted demand.
The reverse pattern, large impressions and low click rates, appears in several South and Southeast Asian markets and in the Gulf. That is consistent with broader or more exploratory searching, with language mismatch between a query and an English-language page, or with our pages appearing for searches they only partly answer. The data cannot distinguish between those explanations, and it would be a mistake to treat low click rates as a verdict on interest in those markets.
How this appears across the KSTATION range
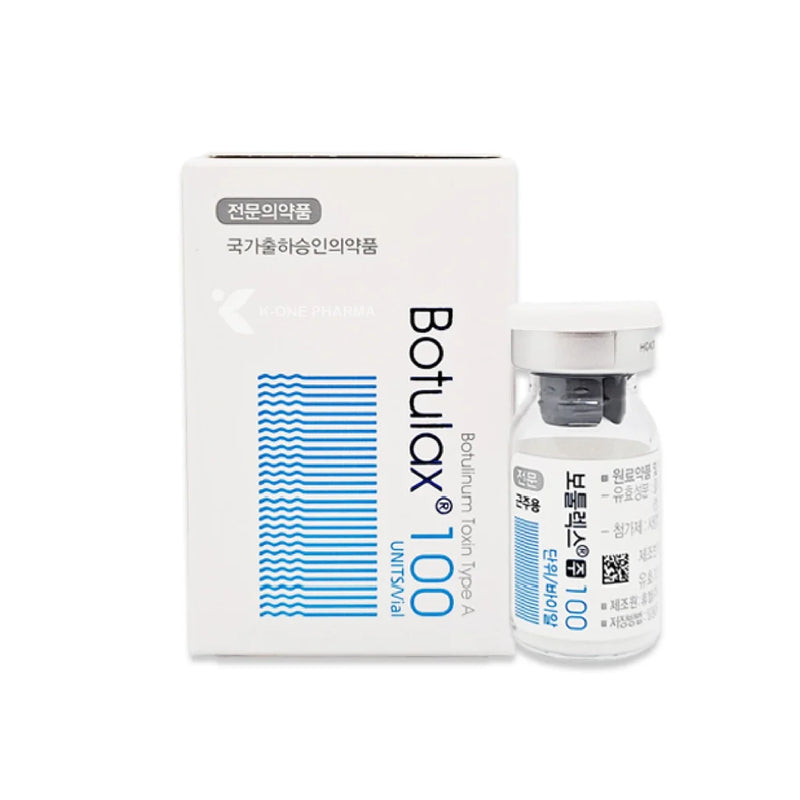
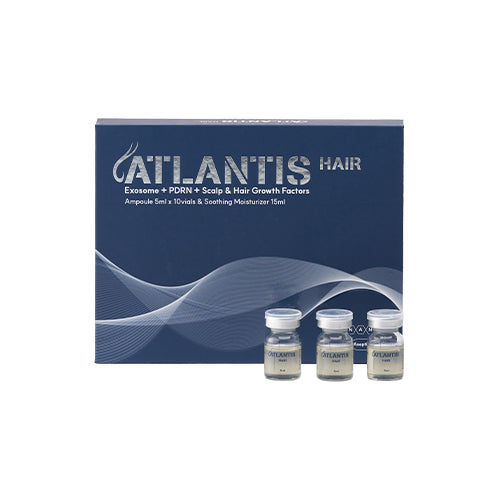
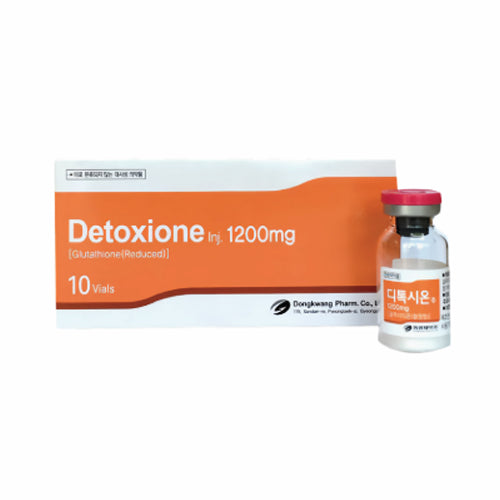
A few pages show the category patterns clearly. Botulax is among the toxin pages with the widest spread of countries, drawing its impressions from the United States, the Philippines, Indonesia, the United Kingdom, Malaysia, the United Arab Emirates and India with no single country above a quarter. Atlantis Hair is the product at the centre of the Bangladesh-led hair and exosome pattern. Detoxione is one of the injectables whose visibility is heaviest in the United States and the Philippines. The whole range is browsable under shop all.
Frequently asked
Which countries search most for Korean aesthetic products?
In ninety days of search data for one Korean aesthetic catalogue, the United States produced 36 percent of impressions and 41 percent of clicks. The Philippines was second with 9 percent of impressions, followed by the United Kingdom, South Korea and Malaysia.
Where does demand for Korean lipolytic injections come from?
In this sample the Philippines led lipolytic product-page impressions with 7,062, slightly ahead of the United States with 6,841. The United States produced more clicks, 334 against 150.
Do different Korean aesthetic product categories have different markets?
Yes. The United States leads most categories, but the second market changes: the Philippines for vitamins, boosters and toxins, Thailand for fillers, and Bangladesh leads the hair and exosome category outright.
Sources and references
- Google Search Console, kstations.com, performance by country, all pages and product pages, 14 June to 11 September 2026. All pages: 434,183 impressions, 15,793 clicks. Product pages: 140,828 impressions, 4,327 clicks.
- Product categories as assigned in the KSTATION catalogue.
Figures describe one site's search visibility over one period, with countries as attributed by Google. They are not sales figures and not a statement about where any product may lawfully be imported, sold or used.